The content describes a trading strategy called the “Danger Zone” approach, which identifies price areas where retail stop losses cluster near resistance, support, equal highs, or equal lows. It explains that institutional traders use these clustered stop orders to fill large positions, creating liquidity sweeps that trap retail traders.
A four-step framework is outlined for identifying these zones, configuring MetaTrader 5 charts to track volume and price action, waiting for confirmation through wick rejections, and entering trades only after the sweep occurs. The approach contrasts retail trading habits, which often result in premature entries and stop-outs, with an institutional method that waits for liquidity clearance before entering positions.
The “Danger Zone” Strategy: How to Trade Liquidity Sweeps Like a Pro
Most retail traders jump into trades the moment a chart pattern shows up — right at resistance levels or breakout points. What they don’t know is that institutional traders are watching those same spots. And they’re not there to trade alongside you. They’re there to use your stop losses as fuel for their own entries.
This is called a liquidity sweep, and understanding it can completely change how you trade.
What Is the “Danger Zone”?
The Danger Zone is any price area where a large number of retail stop losses are sitting and waiting to be triggered.
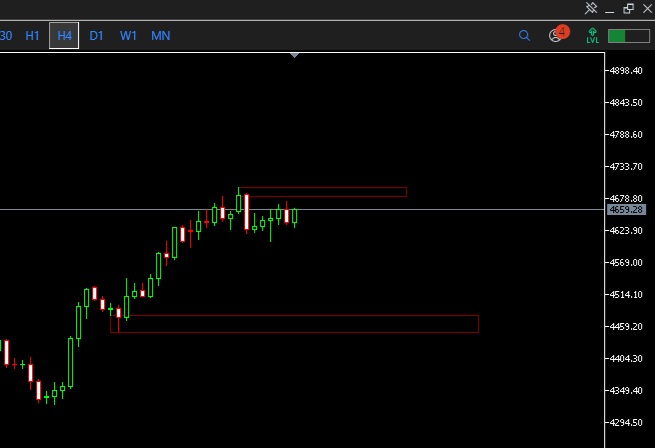
Here’s where they typically cluster:
- Above resistance or equal highs — This is where short sellers place their stop losses and where breakout buyers place their entry orders.
- Below support or equal lows — This is where buyers place their stop losses and where breakdown sellers enter.
Why does this matter? Because large institutions trade with millions of dollars. They can’t simply click “Buy” or “Sell” without moving the market against themselves. They need a large pool of orders on the other side to fill into — and retail stop losses provide exactly that.
In simple terms: the crowd’s stop losses become the institution’s entry orders.
The 4-Step Framework for Trading Liquidity Sweeps
Step 1: Map the Danger Zone — and Stay Out of It
Start by identifying obvious price levels on your chart. Look for:
- Double tops or double bottoms
- Equal highs or equal lows
- Areas that automated trading scanners would flag immediately
Once you find the level, draw a box roughly 5 to 15 pips around it. This is your Danger Zone.
Rule: Do not place any entry orders or stop losses inside this box when price first approaches it.
Step 2: Set Up Your Chart Properly (MT5 Walkthrough)
If you’re using MetaTrader 5, here’s how to track these levels effectively:
- Mark Equal Highs and Lows: Use the Horizontal Line tool (
Alt + H) or the Rectangle Tool to highlight key swing points on the M15 or H1 timeframe. - Enable Tick Volume: Press
Ctrl + Lto turn on volume bars at the bottom of your chart. A sudden spike in volume as price enters your marked zone is a strong signal that stop orders are being triggered. - Check Market Depth (Optional): Press
Alt + Bto open the Depth of Market window. For major pairs like EUR/USD, this shows you where large orders are sitting around key levels.
Step 3: Wait for the Sweep — Don’t Chase It
This is the hardest part for most traders: doing nothing while price moves into your zone.
Let price push into the Danger Zone and trigger the retail stop losses. What you’re looking for is:
- A sharp candle wick that pushes beyond the key high or low
- Price quickly snapping back below (or above) the level it just broke
- This happening on the M15 or H1 timeframe for a clearer picture
That wick tells you institutions have stepped in, absorbed all the orders, and are now pushing price in the opposite direction.
Step 4: Enter Outside the Danger Zone
Once the candle closes back inside the previous price structure — leaving a clear rejection wick sticking out above the Danger Zone — that’s your signal to act.
Here’s how to execute the trade:
- Entry: Use a Market Order (
F9) or place a Sell Limit in the direction of the rejection - Stop Loss: Place it 2 to 3 pips above the highest point of the sweep wick — the area where liquidity has already been cleared out and is unlikely to be revisited
Retail vs. Institutional Approach: Side by Side
| Retail Approach | Institutional / SMC Approach |
|---|---|
| Enters on the first test or breakout signal | Waits for the sweep and rejection first |
| Stop loss sits inside the obvious crowd cluster | Stop loss placed above the confirmed sweep wick |
| Gets stopped out right before the real move | Enters after liquidity is cleared |
The Bottom Line
The market doesn’t move randomly. Large players need your stop losses to fill their positions, and the most obvious levels on your chart are exactly where they hunt.
Stop being the liquidity that gets swept. Identify where the crowd is trapped, let the market clean out the Danger Zone, and only enter once the path is clear.
That’s not just smarter trading — that’s trading on the right side of the market.