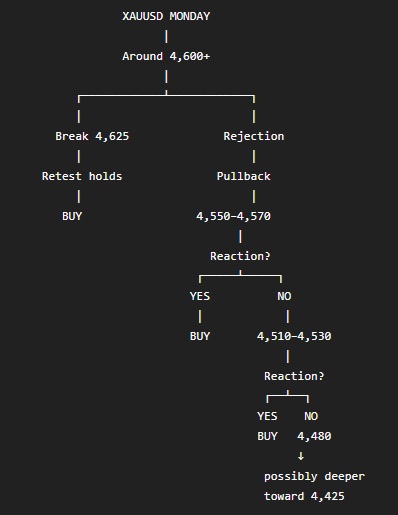
The content outlines three possible XAUUSD price scenarios for Monday’s trading session based on technical chart analysis. The bullish continuation scenario involves watching the 4,625 resistance level for a break-retest-hold pattern before buying, with potential upward progression toward 4,650 and 4,680.
The pullback scenario suggests price may retrace into fair value gaps (FVGs) around 4,550–4,570, 4,510–4,530, or 4,480 before a buy setup forms, emphasizing trading confirmed setups rather than trend-following. A deeper correction scenario considers a larger FVG zone around 4,367–4,425 if price breaks through nearer support levels without reaction, potentially still leading to a bullish continuation.
My three scenarios for Monday
1. 🟢 Bullish continuation — BUY after confirmation
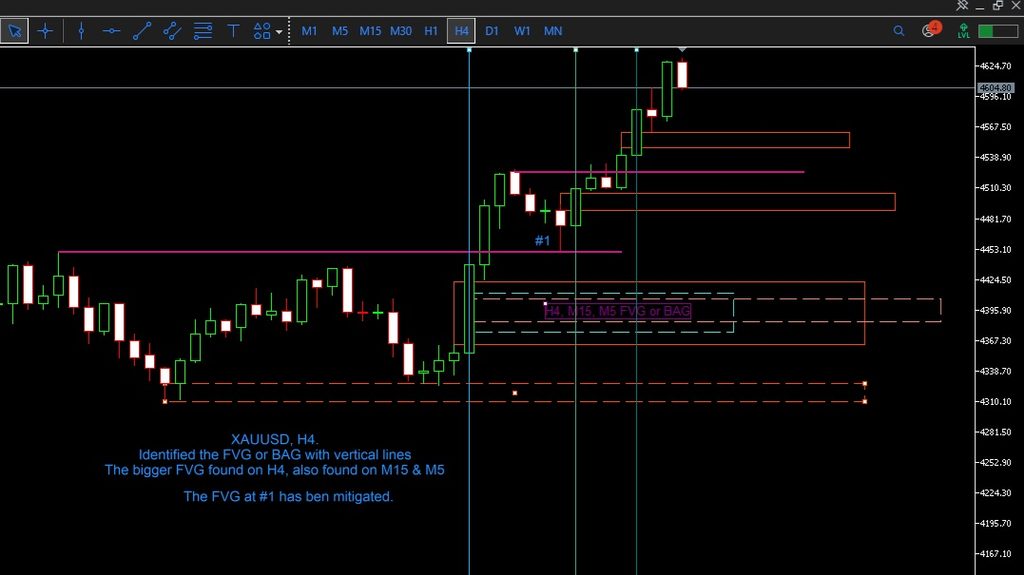
Your chart has:
- Higher highs
- Higher lows
- Strong impulsive candles
- Several smaller FVGs left below price
- Price sitting above the previous resistance areas
The first thing I would watch is the 4,625 area, approximately Friday’s H4 high.
If Monday opens around 4,600–4,620 and then:
4,625 breaks → retest → holds → bullish candle
that would be the cleanest continuation setup.
Potential progression:
4,625 → 4,650 → 4,680+
But I would not chase a huge bullish candle immediately after the break. Wait for the retest.
2. 🟡 Pullback first — probably the most interesting scenario
This is actually the scenario I would like most for your trading style.
Price has moved quite aggressively upward. The last candle on your chart is already red after reaching approximately 4,625.
So Monday could do something like:
Open → push slightly higher → rejection → retracement
and come back toward one of your FVGs.
Your chart has approximately:
4,550–4,570 area
↓
4,510–4,530 area
↓
4,480 area
These become potential areas to look for a BUY setup, rather than buying at the current high.
For example:
Price retraces into FVG → M15/M5 shows rejection → CHoCH/BOS upward → BUY.
That would fit very nicely with the principle we’ve discussed before:
Don’t trade simply because the trend is bullish. Trade when the SETUP appears.
3. 🔴 Deeper correction
This is the scenario we shouldn’t ignore.
If Monday opens and price starts falling, I would watch whether the smaller FVGs are actually respected.
Something like:
4,600
↓
4,550
↓
4,510
↓
4,480
If price goes through those areas without meaningful reaction, the bigger FVG you marked around 4,367–4,425 becomes much more interesting.
That doesn’t automatically mean SELL.
It could simply mean:
H4 bullish trend → deep retracement → larger demand/FVG → possible continuation BUY.