The Uncomfortable Truth Every Trader Needs to Hear
You have everything lined up. Trend. Market structure. VWAP. EMA. MACD. RSI. Volume. Candlestick confirmation. Breakout confirmation.
You look at the chart and say: “This is a 90% setup.”
And then the market does the complete opposite.
Sound familiar? Here is why that happens — and more importantly, what you should do about it.
Your Indicators Are Observers, Not Controllers
This is the part that trips up most traders. Every tool you use — EMA, MACD, RSI, VWAP, volume, fair value gaps — is simply measuring what has already happened or what is currently happening.
They are observations. They are not instructions to the market.
The market does not receive your analysis. It does not care that every indicator on your chart is screaming SELL. A single large unexpected order, a surprise news event, a sudden liquidity shift, or simply a change in the balance of buyers and sellers can flip everything in seconds.
That is not a flaw in your analysis. That is just how markets work.
What Does “90% Confidence” Actually Mean?
Here is where many traders quietly fool themselves.
Unless you have rigorously back-tested a specific setup across hundreds or thousands of trades, your “90% confidence” is really just a feeling. And feelings, however strong, are not statistics.
The market has no idea how confident you are.
A healthier way to frame your thinking is this:
“The evidence currently favours SELL, but BUY remains possible.”
That single sentence changes your entire approach. It keeps you honest. It keeps you prepared.
Why Risk Management Is Not Optional
Suppose your analysis correctly identifies that SELL probability is greater than BUY probability. You enter the trade. Then the market flips against you.
The wrong response: “My analysis was useless.”
The right response: “The market produced an outcome that was within the range of possible outcomes. My predefined risk controls the damage.”
That is the game. You are not trying to be right 100% of the time. You are trying to build positive expectancy over a large number of trades.
Here is a simple example to make that concrete:
- A strategy that wins 45% of its trades can still be profitable
- As long as the average winner is significantly larger than the average loser
- Consistency and risk control do the heavy lifting over time
No single trade defines your results. Your process does.
How to Reduce Uncertainty Step by Step
Think about watching price action develop candle by candle:
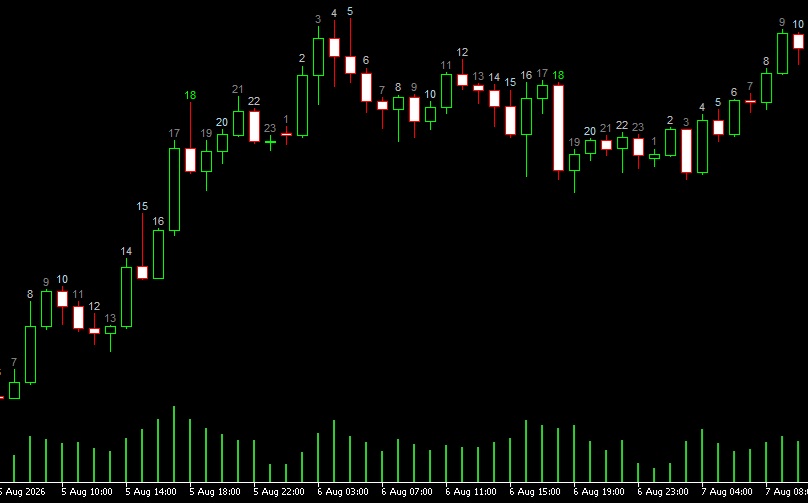
- Candle 17: Strong buying appears → Uncertainty is high
- Candle 18: Selling begins to emerge → Uncertainty remains high
- Candles 19–20: Sellers continue making downward progress → Uncertainty starts to decrease
- Later: Structure breaks, retest fails, bearish continuation confirms → Evidence becomes considerably stronger
Each step reduces uncertainty. None of them eliminate it entirely.
This is not a weakness in your method. Waiting for follow-through, confirmation, and continuation is actually a disciplined way of stacking evidence before you commit risk.
Change the Objective Entirely
Stop asking: “How do I find the perfect trade?”
Start asking: “Has the market given me enough evidence that the potential reward justifies the remaining uncertainty?”
That shift in mindset is everything.
The Rugged Road Analogy
Imagine driving a difficult off-road track. You study the route carefully. You choose the right vehicle. You check the tyres. You know every pothole on the map. You drive slowly and deliberately.
You still cannot guarantee you will not hit an unexpected rock around the next corner.
So you do not drive as though the road is perfectly safe. You drive with margin for error.
Good trading works exactly the same way:
- Analysis reduces uncertainty
- Confirmation reduces it further
- Risk management survives whatever uncertainty remains
And that last part — surviving the uncertainty that remains — is something no indicator on your chart can ever replace.
That is not a weakness to overcome. That is the reality to accept.